Changes to VED implemented in April 2017 caused significant upheaval for the UK motor industry and started a move away from CO2 based taxation which may have implications for the trend of continuing decline in CO2 emissions from cars in the UK.
This material was originally produced in March 2017 ahead of the implementation of VED reform the following month.
Company Car Tax (CCT) (described below) is also linked to CO2 emissions and strongly incentivises lower CO2 vehicles. However, CCT only affects a sub-set of the cars driven on UK roads, VED affects ALL vehicles driven on UK roads. Changes announced to CCT in Autumn 2017 do need to be covered and discussed, but not in this article.
Background
In the Autumn 2015 budget statement the then Chancellor of the Exchequer, George Osborne, declared that from 1st April 2017 the UK Government would make sweeping changes to "road tax" or Vehicle Excise Duty (VED) as it is correctly known. This gave the UK motor industry, SMMT and DVLA around 18 months to implement very significant changes to the UK vehicle registration system known as AFRL (Automated First Registration and Licensing system). That may seem like ample time, but in reality as we will see it presented significant difficulties for all involved.
Firstly, we need to briefly look at the main taxes and duties levied on motorised road-going transport in the UK.
Taxes and Duties related to cars (and some other vehicles) in the UK
Vehicle Excise Duty (VED) – also (incorrectly) known as Road Tax, Car Tax, “the tax disc”, Road Fund Licence
- Annual charge levied on all motor vehicle kept or driven on UK roads
- VED is a tax on ownership of the vehicle
- VED affects ALL vehicles - even if they are zero rated
- Per unit of fuel
- Fuel Duty is a tax on use of the vehicle
- Fuel Duty affects all vehicles on UK roads that burn fossil fuels
Company Car Tax (CCT) – A “Benefit in Kind” (BIK) tax paid as part of Income Tax if an employer provides a vehicle for their employees' private use.
- Linked to CO2 emissions with surcharges for diesel cars
- Employees pay income tax and National Insurance Contributions (NICs) on the BIK value of their vehicle
- Employers also pay their portion of the NICs on the BIK value of the vehicle
- CCT only affects those vehicles that are made available by a company for their employees' private use.
Writing Down Allowance (WDA) – for companies, determines the rate at which the depreciation of a vehicle can be offset against taxable profits
- Linked to CO2 emissions
- WDA only affects those vehicles that are purchased (or leased in some cases) by a company.
Value Added Tax (VAT)
- Levied on the purchase price of most goods and services
- Rates vary, but typically 20% (as of Dec 2017)
- VAT affects all vehicles
First Registration Fee (FRF)
- A "fee" (rather than tax or duty) levied by DVLA at the time of first registration of a vehicle to cover the cost of its administration during its life
- Currently £55 (as of Dec 2017)
- FRF affects all vehicles
Before we look at what the new VED Reform scheme entails, we need to establish what the pre-April 2017 scheme was
The pre-April 2017 VED scheme
- VED based on the CO2 emissions of the vehicle
- The higher the CO2 emissions of the vehicle the more VED is due
- There is one rate for the first year (First Licence Rate) and another for the second and subsequent years (Standard or Annual Rate)
- The Annual Rate, like the First Licence Rate also increases with CO2 emissions
VED Reform outline
- In 2015 the Government announced that the way in they charge Vehicle Excise Duty (VED) on cars would change from 1st April 2017.
- This has come to be known as “VED Reform” and the DVLA would implement this change for all new car registrations from 1st April 2017.
- It would NOT apply retrospectively to vehicles registered before that date.
- It would NOT apply to other vehicle types, e.g. Commercial Vehicles, Motorbikes, HGVs.
Size of the UK vehicle market

VED has been through many changes over the years so let's see how it has evolved.
Much of the information in this section came from an excellent House of Commons Briefing Paper, SN0148 - Vehicle Excise Duty (VED). The main points in that document have been distilled below:
- VED introduced 1st January 1889
- All motor cars registered and numbered from 1st January 1904
- Road Board and Road Improvement Grant (paid for by VED) introduced in March 1910
- “Road Fund” replaced Road Board (and grant) in January 1921
- Although historically the road fund tax was considered a hypothecated tax to pay for the building and maintenance of the road network, it was often raided for other purposes.
- Hypothecation was formally ended by the Finance Act 1936.
- “Road Fund” abolished 1st April 1937 – VED now paid into general taxation and not “allocated” to roads.
[Author's note: this means that no-one pays "Road Tax". So for all those angry drivers out there who claim that cyclists should not be on the road because they don't pay road tax. Well neither do you.]
- 1979 Conservative Government considered abolishing VED in favour of increased fuel duty
- A “fairer” tax on use, rather than ownership
- Concluded that requirement for a vehicle register remained (for Police, etc.)
- Therefore there was little to gain from its abolition
- VED based on engine size: above or below 1,549cc
- There were a number of arguments for graduation [of VED] on an environmental basis
- Rather than abolish VED, environmental groups have tended to advocate the ‘greening’ of VED, i.e. dividing it into graduated bands to encourage the purchase of cars that are more environmentally friendly.
- After assuming office in May 1997 the Labour Government indicated that it wished to overhaul the VED system to incentivise people to replace their vehicles with more fuel efficient models.
- A graduated VED system will therefore encourage the purchase of:
- new cars as opposed to older cars;
- cars with lower carbon dioxide emissions and better fuel efficiency; and
- cars using fuels and technology which are better for local air quality
- 1997 Labour Government overhauled VED to be based on CO2 emissions
- Varied the VED rates between the highest and lowest CO2 emitting vehicles
- “Graduated VED”
- 4 bands in 2001
- 6 bands in 2003
- 7 bands in 2006
- 13 bands in 2009
- Various incentives or penalties for certain fuel types
- At this time, the VED rate due in the first year was the same as it was in all other years

Another way to show the same is to highlight difference between the highest and lowest rates of VED in effect at the time. [Note: again, for clarity, fuel specific penalties or incentives not shown]

When graduated VED was first introduced the difference between the highest and lowest rates was just £55. Eight years later it has risen to £405. Note that from 2006/07 onwards some vehicles were zero rated for VED.
During that time average new car CO2 emissions fell by 18%. The chart below shows the average CO2 emission of new cars in the years 2001 to 2010. Note the downward inflexion point in 2007 after the first zero rated VED band was introduced in 2006/07.
The data represented in this chart were obtained by examining the CO2 recorded on the vehicles' registration documentation as reported in the SMMT's registration reporting system.
[Note: this chart uses calendar years rather than fiscal years as above. Obtaining registration data this far back is difficult by fiscal year, but simple by calendar year]

- Average CO2 emissions are coming down
- Government strengthens the policy and message
- New “first year” rate from 2010/11 – the “Showroom tax”
- Different VED rates in the first year compared to annual rates
- Increases first year VED for high emitting vehicles
- Reduces first year VED for low emitting vehicles

As before, another way to see this is to highlight the difference between the lowest and highest VED rates. The next chart shows this. The blue line is the introduction of the first year VED rate (the "showroom tax") in 2010/11.

As the effect of the "showroom tax" hits the market, the decline in CO2 emissions accelerates with a further 17% drop in just 6 years (compared with the earlier 18% drop in 9 years). [Note: again, this registration chart shows calendar years rather than fiscal years]

So, from a historical point of view, that brings us up to date, March 2017 anyway. Let's look at the VED scheme that was in place as of that time.
- Different VED rates in the first year compared to annual rates
- Increases first year VED for high emitting vehicles
- Reduces first year VED for low emitting vehicles
- £10 reduction in VED rates for "Alternate Fuel Vehicles" (AFVs), e.g. hybrid or LPG. [Not shown for clarity]
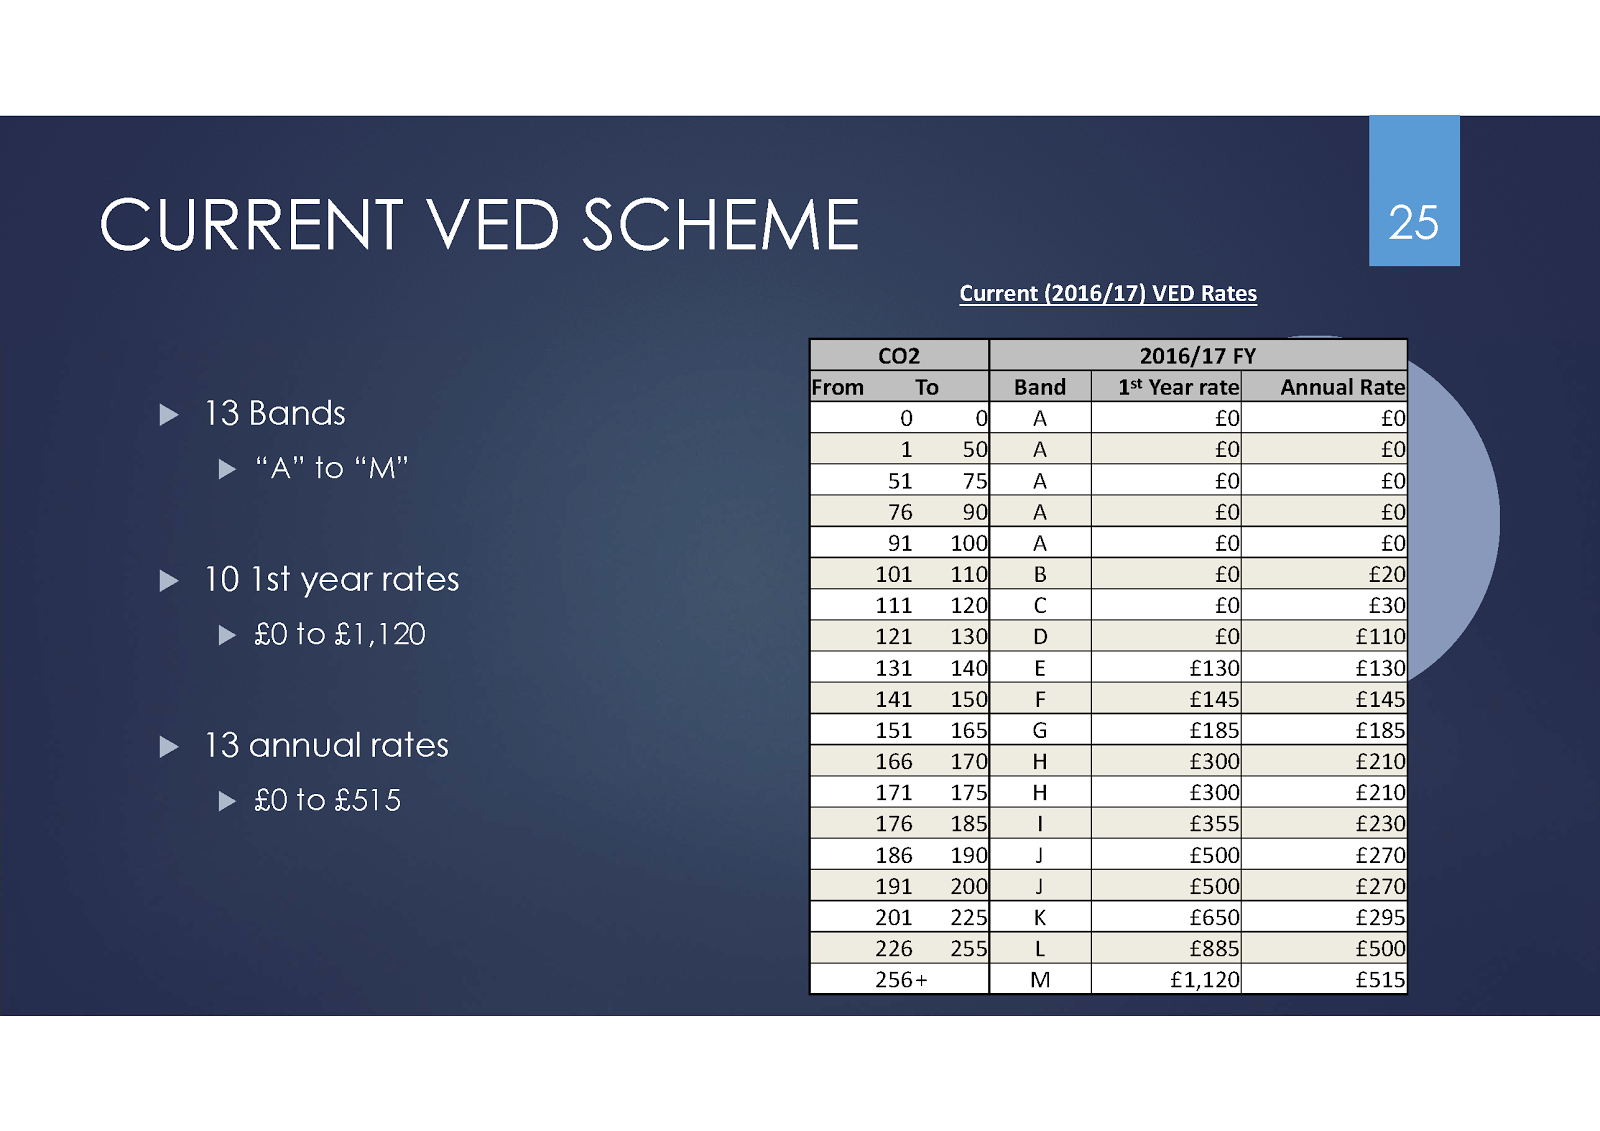
Note that vehicles emitting up to 130g/km CO2 pay no VED in the first year and those that emit up to 100g/km CO2 pay no VED at all. These two CO2 "breakpoints" become significant targets for manufacturers to aim for. The 130g/km target also ties closely to a 129g/km breakpoint in the WDA (described above) in effect at the time.
Having seen the pre-April 2017 scheme, let's look at its effect. The following chart shows how the registrations in the calendar years from 2010 to 2016 are broken down into the 13 different VED bands. Note the huge rise in proportion of vehicle that pay no VED in the first year (Band D and below) and those that pay no VED at all (Band A).
 Now, I'm not trying to suggest that the trend for lower emitting vehicles is due entirely to the VED schema alone, other taxation (such as CCT and WDA) and increased environmental awareness will have also contributed. However, as VED affects all vehicles on the road and is probably the most visible to the general public (as it hits their pocket every year), it is a significant incentive for people to want lower emitting vehicles.
Now, we have the CO2 figures for the vehicles registered over the past few years and the VED rates that were in effect for those years are known (I've been tracking them since about 2000). This means we can match the number of vehicles registered in each VED band against the VED rates that were in effect for each band to come up with the total VED revenue that would have been generated for the Government in each year.
[Note: I have had to make small approximations in this calculation:
The registration figures are recorded in calendar years, but the VED rates and bands are recorded for fiscal years, i.e. April to March. This means that there is a 3 month (Jan-March) discrepancy between the calendar year registration figures and the fiscal year VED rates. Nevertheless, it should still give us a good indication of the trend.
For the Annual VED figures, I have calculated based on the Annual rate that was in place at the time the vehicle was first registered. I have not calculated using the rate for the second year (when that annual VED rate would actually be due)]

Looking back to the first chart we saw annual registrations increasing from 2011 onwards. Despite that increase, total and average VED revenues have continued to fall over the following years. In 2016 the Government raised approx £117m (45%) less revenue from VED on new cars as it did in 2010. If we look at the Annual VED revenue due on new cars in future years, this falls by approx £52m (22%) over the same period.
This reduction in VED revenue must have had an impact of the public finances. Looking at the figures it was clear that VED needed reforming if the Government was to recover some of the revenue they were missing out on.
Next blog update: VED Reform and its potential impact.
Having seen the pre-April 2017 scheme, let's look at its effect. The following chart shows how the registrations in the calendar years from 2010 to 2016 are broken down into the 13 different VED bands. Note the huge rise in proportion of vehicle that pay no VED in the first year (Band D and below) and those that pay no VED at all (Band A).

Now, we have the CO2 figures for the vehicles registered over the past few years and the VED rates that were in effect for those years are known (I've been tracking them since about 2000). This means we can match the number of vehicles registered in each VED band against the VED rates that were in effect for each band to come up with the total VED revenue that would have been generated for the Government in each year.
[Note: I have had to make small approximations in this calculation:
The registration figures are recorded in calendar years, but the VED rates and bands are recorded for fiscal years, i.e. April to March. This means that there is a 3 month (Jan-March) discrepancy between the calendar year registration figures and the fiscal year VED rates. Nevertheless, it should still give us a good indication of the trend.
For the Annual VED figures, I have calculated based on the Annual rate that was in place at the time the vehicle was first registered. I have not calculated using the rate for the second year (when that annual VED rate would actually be due)]

The chart shows the 1st year VED revenue from new cars in each year in £millions (the blue bars), the future Annual VED revenue from the new cars in each year in £millions (the orange bars). The per vehicle average rates for the 1st year and annual rates are then shown as the grey and orange lines.
Looking back to the first chart we saw annual registrations increasing from 2011 onwards. Despite that increase, total and average VED revenues have continued to fall over the following years. In 2016 the Government raised approx £117m (45%) less revenue from VED on new cars as it did in 2010. If we look at the Annual VED revenue due on new cars in future years, this falls by approx £52m (22%) over the same period.
This reduction in VED revenue must have had an impact of the public finances. Looking at the figures it was clear that VED needed reforming if the Government was to recover some of the revenue they were missing out on.
Next blog update: VED Reform and its potential impact.
No comments:
Post a Comment